

QuoteDaddy Pro Terminal
Institutional-grade research.Cutting-edge AI built in.
The Wall Street research desk, in your browser. Live markets, deep fundamentals, SEC filings and smart-money flow, with AI analysts working alongside you on every stock.
- AI analysts that read filings, earnings and the numbers with you
- Live markets, charts and technical signals: stocks, indices, bonds, commodities and crypto
- Deep fundamentals: financials, DCF valuation, analysts, peers and SEC filings
- Smart-money tracking: insider trades, unusual volume and short-sale flow
- Idea generation: factor ranks, an opportunity radar, a screener and catalysts
AI built in
An AI research team on every stock
Each AI tool works from the terminal’s own data: live figures, analyst ratings, headlines and the company’s SEC filings, so its answers can be checked against the source.
- Ask AIChat with an AI analyst about one stock, or about anything, including your own portfolio.How it works →
- Earnings AIAn AI reads a company's latest earnings filings and quotes the proof.How it works →
- Investor LegendsCheck any stock against the rules of 12 famous investors, then ask AI for a take in their style.How it works →
- Opportunity radarStocks where financials, market activity and insider buying all point the same way.How it works →
Earnings AI
It reads the filings. You get the signal.
Earnings AI pulls a company’s latest earnings release and its two most recent quarterly or annual reports straight from the SEC, then points out guidance changes, tone shifts and mixed messages. Every point comes with a quote from the filing, and the terminal checks the quote is really there.
Management's discussion and analysis
Revenue for the quarter was $4.82 billion, up 9% from a year earlier,
driven by subscription growth and higher average selling prices.
Operating margin was 21.4%, compared with 19.8% last quarter.
Outlook
Based on results to date, we now expect full-year revenue growth of 12% to 14%,
up from the 10% to 12% range we gave last quarter.
Capital spending is expected to remain close to the prior plan.
Results by region
Asia Pacific, our largest region, grew 2% after 8% last quarter.
Demand in our largest region softened during the quarter, and
order growth in Europe slowed to 3%.
Gross margin
Margins expanded, although input costs remain elevated,
and we expect some pressure on gross margin next quarter.
Freight and logistics costs were broadly flat.
Pulling the 10-Q and earnings release from SEC EDGAR…
Reading management's discussion…
Comparing with last quarter's filing…
Checking every quote against the filing…
Done · 3 findings, every quote verified
“we now expect full-year revenue growth of 12% to 14%”
Up from 10% to 12% in the last filing.
✓ Quote found in the filing
“Demand in our largest region softened during the quarter”
Last quarter called demand there strong.
✓ Quote found in the filing
“Margins expanded, although input costs remain elevated”
Margin up now, pressure flagged for next quarter.
✓ Quote found in the filing
Illustration: a made-up company and findings.How Earnings AI works →
Illustration. Scores shown are examples, not live picks.
Opportunity Radar
The whole S&P 500, swept every night.
RADAR checks eight independent signals on every stock in the S&P 500 after each US market close. A stock lights up only when signals from at least two different areas agree, and it gets a score out of 100 with the reasons in plain English.
- Explain with AI: why it’s on the radar, what would confirm it, and what could go wrong, with every number checked.
- My stocks: score your own portfolio and watchlist the same way.
- Warnings flag earnings within 7 days, a stretched RSI and thin trading.
Sample results
As shown in the terminal on 28 Oct 2026 · not recommendationsMU
Micron Technology · Information Technology
84
/100 score
Growth ranks in the top 1% of Information Technology (sales +256% last year) · Free cash flow up 3435% to $59B over the last 12 months
GrowthCash flowMomentumagrees across financials + market
ORCL
Oracle Corporation · Information Technology
81
/100 score
Beat the EPS estimate the last 2 quarters (latest by 8.2%) · Traded 2.9× its usual volume on a +10.8% day (Oct 28)
EarningsVolumeInsidersagrees across financials + market + insiders
UBER
Uber · Industrials
74
/100 score
2 insiders bought $15.3M of stock in the last 90 days · Value ranks in the top 11% of Industrials (earnings yield 7.5%)
InsidersValueEarningsagrees across financials + insiders
Your mix
Return 14.7%
Risk 19.8%
Sharpe 0.53
Lowest risk
Return 10.1%
Risk 14.0%
Sharpe 0.42
Best risk-adjusted
Return 21.3%
Risk 22.7%
Sharpe 0.75
Illustration with six example stocks. The terminal plots 3,000 mixes of yours.
Portfolio optimiser
Your portfolio, run through 3,000 scenarios.
Load your holdings or your watchlist in one click (up to 12 stocks). The Optimise tab takes a year of daily prices, tries 3,000 random long-only mixes of them, and maps each one by risk and return, so you can see where your current mix sits.
- Your mix: your weights, with their return, risk and Sharpe ratio.
- Lowest risk: the mix with the least volatility, found by stepping towards lower risk 3,000 times.
- Best risk-adjusted: the mix with the highest Sharpe ratio, the most return per unit of risk above a 4.25% risk-free rate.
Plus a correlation table showing which of your stocks move together, and how diversified you really are. Based on past prices: a guide, not a forecast.
How the optimiser works →Quant · factor ranks
Six factors. Every S&P 500 company. Scored like a quant desk.
QUANT builds 17 ratios for every company from its SEC filings and a year of prices, groups them into six factors, and scores each from 0 to 100 against its own sector, so a bank is judged against banks and a chipmaker against chipmakers. Sort by any factor, filter by sector, and hover a score to see the ratios behind it.
- Value
- How cheap the shares are for the profits, cash, assets and sales behind them.
- Momentum
- The 12-month return skipping the latest month, plus the 6-month return.
- Growth
- How fast sales and earnings per share grew in the latest fiscal year.
- Quality
- Gross profit on assets, and profits backed by real cash.
- Profitability
- Returns on equity and assets, and margins on every sales dollar.
- Balance sheet
- Little debt, and enough short-term assets to cover short-term bills.
| # | Company · sector | Overall | Value | Momentum | Growth | Quality | Profit. | Balance |
|---|---|---|---|---|---|---|---|---|
| 1 | Information Technology | 100 | 76 | 99 | 100 | 64 | 99 | 96 |
| 2 | Materials | 100 | 61 | 76 | 96 | 96 | 96 | 93 |
| 3 | Energy | 99 | 95 | 83 | 90 | 100 | 95 | 25 |
| 4 | Financials | 98 | 75 | 63 | 92 | 95 | 77 | 77 |
| 5 | Real Estate | 97 | 90 | 100 | 69 | 93 | 59 | 55 |
| 6 | Consumer Discretionary | 96 | 89 | 35 | 80 | 78 | 91 | 89 |
| 7 | Health Care | 95 | 58 | 62 | 100 | 64 | 85 | 93 |
Illustration. Scores shown are examples, not live ranks.
Investor Legends
Twelve legendary playbooks. One click.
Score any stock against the rules of 12 of the most famous investors in history, then ask the AI for a take in their style. Every check below is one the terminal actually runs.

Warren Buffett
Quality compounders at a fair price
Look for durable businesses with high returns on equity, wide margins and little debt, run by capable managers, and pay a sensible price for them. Hold for many years.
- ROE ≥ 15%
- Operating margin ≥ 20%
- Debt / equity ≤ 0.5×
- EPS growth (5Y) ≥ 10%
- P/E ≤ 25×

Charlie Munger
Great businesses, few decisions
- ROIC ≥ 15%
- Gross margin ≥ 40%
- Debt / equity ≤ 0.8×
- Revenue growth (5Y) ≥ 5%
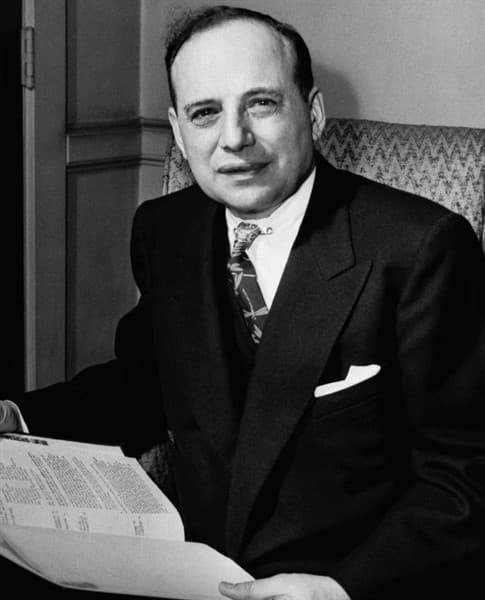
Benjamin Graham
Deep value with a margin of safety
- P/E ≤ 15×
- P/B ≤ 1.5×
- Current ratio ≥ 2×
- Dividend yield ≥ 0.01%
- EPS growth (5Y) ≥ 0%

Peter Lynch
Growth at a reasonable price
- PEG ≤ 1×
- EPS growth (5Y) ≥ 10%
- Debt / equity ≤ 0.6×
- P/E ≤ 30×

Philip Fisher
Outstanding growth companies
- Revenue growth (5Y) ≥ 10%
- Gross margin ≥ 40%
- Operating margin ≥ 15%
- Net margin ≥ 10%

John Templeton
Buy at maximum pessimism
- P/E ≤ 12×
- P/B ≤ 1.5×
- Price vs 52-week high ≤ 70%

Joel Greenblatt
Magic formula: good and cheap
- ROIC ≥ 20%
- EV / EBITDA ≤ 10×

Seth Klarman
Margin of safety, patient value
- P/B ≤ 1.5×
- FCF yield ≥ 6%
- Debt / equity ≤ 0.5×

Bill Ackman
Concentrated quality, cash-generative
- FCF yield ≥ 4%
- Operating margin ≥ 20%
- Debt / equity ≤ 1.5×
- Revenue growth (5Y) ≥ 5%

Michael Burry
Contrarian deep value on cash flow
- FCF yield ≥ 10%
- EV / EBITDA ≤ 8×
- P/B ≤ 1×

Stanley Druckenmiller
Growth and momentum
- Revenue growth (TTM) ≥ 15%
- EPS growth (TTM) ≥ 20%
- Price vs 52-week high ≥ 85%

Cathie Wood
Disruptive innovation
- Revenue growth (5Y) ≥ 20%
- Revenue growth (TTM) ≥ 25%
- Gross margin ≥ 50%
- ✦ Try it on any stockOpen a stock and choose Legends. All 12 scorecards appear at once, with an AI commentary in each investor’s style.
Rules are inspired by each investor’s published approach. None of these investors is affiliated with or endorses QuoteDaddy. Information only, not investment advice.
Photos from Wikimedia Commons: Warren Buffett by USA International Trade Administration, public domain; Charlie Munger by Nick, CC BY 2.0; Benjamin Graham by Unknown author, public domain; Seth Klarman by Maryland GovPics, CC BY 2.0; Bill Ackman by Senate Democrats, CC BY 2.0; Cathie Wood by Caroline Wood, CC BY-SA 4.0.
Catalyst calendar
Know what moves a stock before it moves.
CAL lists the dated events that can move a stock over the next 180 days, in one calendar: earnings, FDA decisions and advisory panels, clinical trial readouts, IPO lock-up expiries and annual meetings. Expand an event for the details and a link to its source.
- Filter by event type, and show earnings only for companies worth $2B, $10B or $50B and up.
- “Only my stocks” narrows it to your watchlist and portfolio; your names are starred everywhere else.
- Each stock’s own page shows its next dates, and ALERT can warn you ahead of earnings.
Needs a QuoteDaddy account (sign in at the top of this page).
How the calendar works →Next up
- TodayTrial readoutPhase 3 trial completes (est.)
- in 8dEarningsQuarterly results · after the close
- in 10dAnnual meetingAnnual shareholder meeting
- in 12dLock-up endsIPO lock-up expires
Illustration. Event dates shown are examples.
The full desk
Everything a research desk runs on
26 professional tools in one place. Each has its own guide.
Live prices, charts, technical signals and what the whole market is doing.
Financial statements, valuation, earnings, analysts, peers and SEC filings.
Who is buying and selling: company insiders, unusual volume and short sellers.
Ask questions in plain English and get answers built on the terminal's own data.
Find ideas: factor rankings, the opportunity radar, the screener, catalysts and alerts.
The command line, watchlists, your portfolio and your QuoteDaddy account.
Help and support
Every tool is documented, and the QuoteDaddy team is an email away.